The Challenge
There were many metrics, users had different workflows, and the dashboard needed to work comfortably on both laptops and tablets.

An operations dashboard for monitoring sales, stock, outlet performance, and promotional activity.
There were many metrics, users had different workflows, and the dashboard needed to work comfortably on both laptops and tablets.
We designed the information hierarchy, modular dashboard, period filters, and an interactive prototype for user testing.
User interviews, information architecture, wireframes, design system, prototype, and usability testing.
The team can identify key insights faster, and the weekly reporting process is more concise.
Weekly review
Responsive
User testing
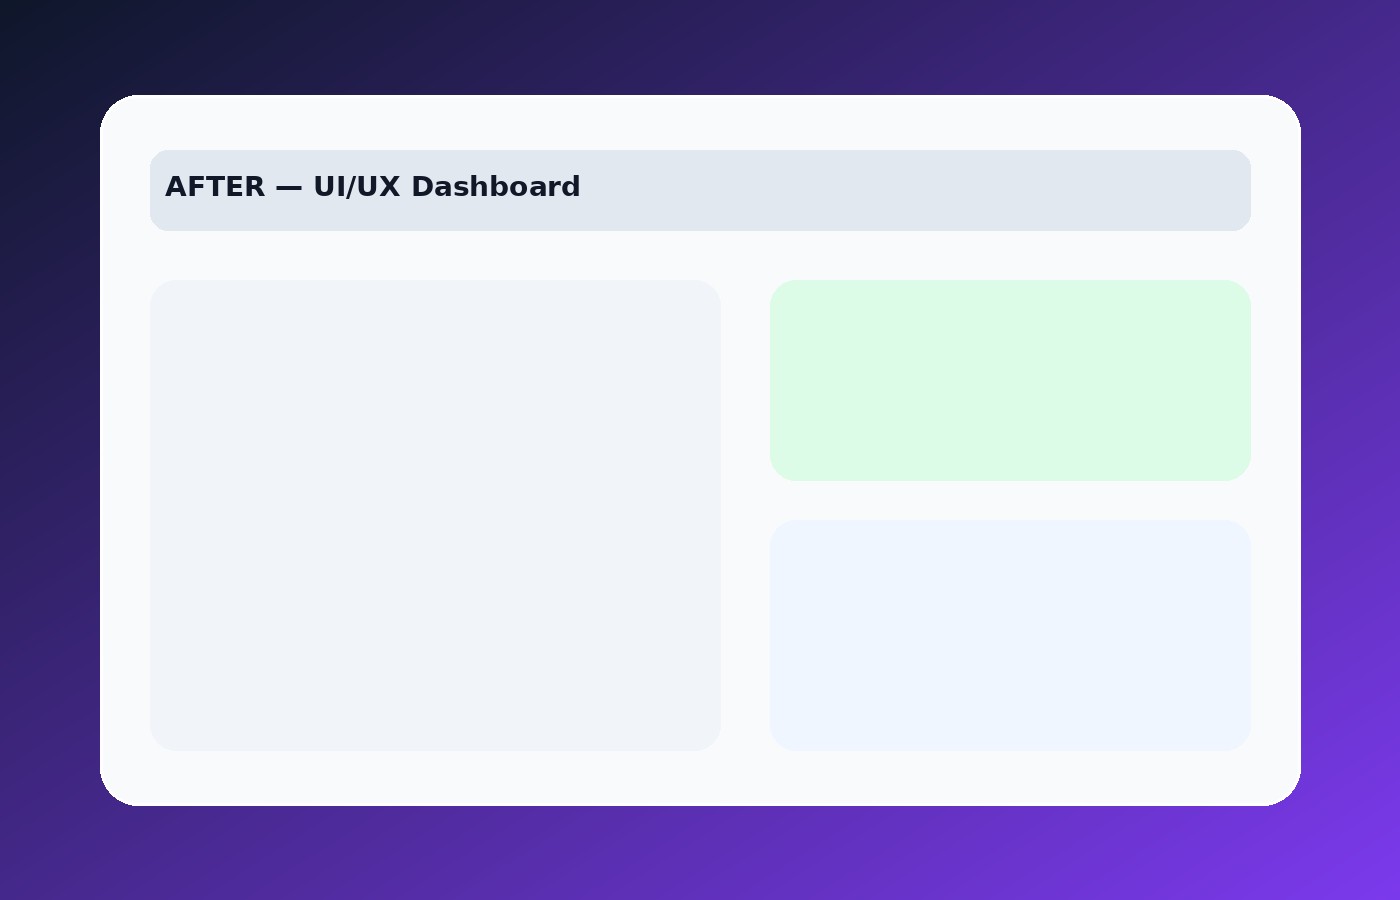 After
After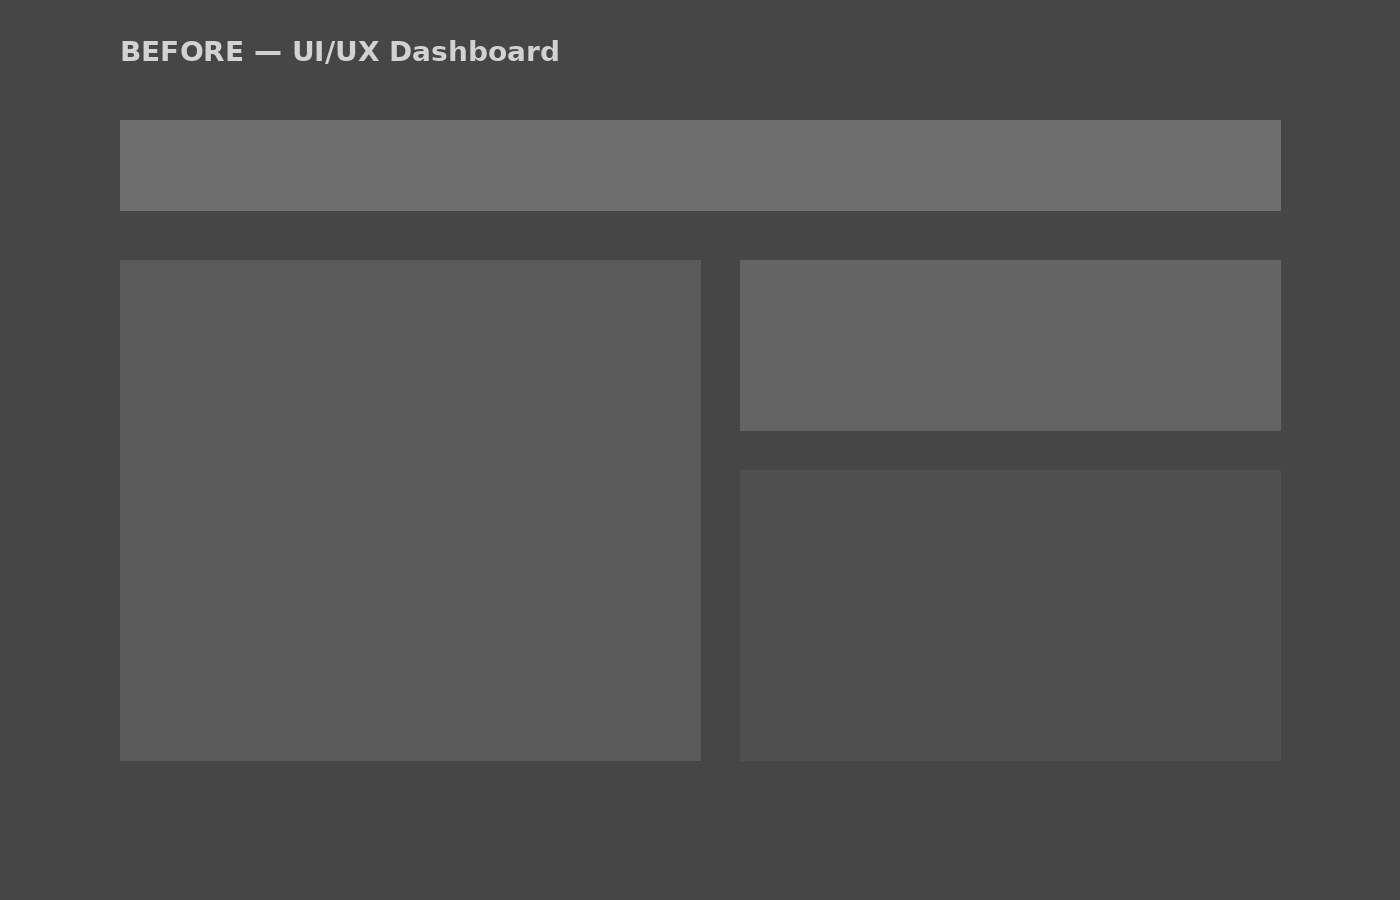 Before
“The dashboard helps us identify outlet issues without opening multiple files or requesting manual recaps.

Fast Delivery
Pengiriman sat set khususnya produk digital, anda bayar produk sudah sampai

24 Hours Support
Support selama 24/7 asal admin belum tidur hehehe

Secure Payment
Keamanan pembayaran terjamin, karena menggunakan PG tersohor

Saya menyediakan jasa website, digital advertising, SEO, dan pengelolaan pemasaran digital. Temukan juga plugin WordPress, template website, dan produk digital siap pakai untuk membantu bisnis bekerja lebih cepat dan efisien.
© 2026 - 2026 - Al Faris Store


